Which NPAs need attention to improve health care?
This project deals with the important factors that the top 10 Neighbourhood Profile Areas(NPA) that require immediate attention, as the data and the future predictions indicate that it's high time
Why?
The quality of life in charlotte seems to be progressive and exponential. It's always good to focus on 99.9% when you are above 90%. Thus, this project involves necessary proofs and reasons to improve specific NPAs that need immediate attention.
How?
With the help of available dataset, this project provides necessary proofs to support the claims made. Also, with the help of linear regressioin and Elasticnet, we were able to predict future outcomes
When?
Max predictions involve till the year of 2020
Check for:
Age: Sum of age at time of death for all deaths, divided by total number of deaths. These data are cumulative for the previous 24 months.
Pharmacy Units: Number of housing units within ½-mile of a pharmacy.Only includes pharmacies located inside Mecklenburg County.
Public Health Insurance: Number of residents with public health insurance, dividedd by the total population estimate.
Low_Cost_Healthcare_Proximity_Units: Number of housing units within ½-mile of a Medicaid provider or free clinic, divided by the total number of housing units.
Import necessary libraries for the analysis
import pandas as pd
import numpy as np
import matplotlib.pyplot as plt
%matplotlib inline
Read the datasets and clean it
health = pd.read_excel('QOL Data Download October 2018.xls', sheetname='Health')
health.head()
health.columns = health.iloc[0]
health.drop(0,axis=0,inplace=True)
health.head()
Age of Death (Average). Data cleansing and predicting the number for the year 2019
- Finding out the null values
- Filling the null values with the mean
- Create a model and predict the values within the dataset
- Use the same model to predict for the year 2019
features = ['Age_of_Death_2010','Age_of_Death_2012','Age_of_Death_2014','Age_of_Death_2016']
for i in features:
    print('Null values in', i, 'are' ,health[i].isnull().sum())
for i in features:
    val = health[i].mean()
    health[i].fillna(val,inplace=True)
for i in features:
    print('Null values in', i, 'are' ,health[i].isnull().sum())
%%HTML
<div class='tableauPlaceholder' id='viz1553318506098' style='position: relative'><noscript><a href='#'><img alt=' ' src='https://public.tableau.com/static/images/3J/3JY66NKHM/1_rss.png' style='border: none' /></a></noscript><object class='tableauViz' style='display:none;'><param name='host_url' value='https%3A%2F%2Fpublic.tableau.com%2F' /> <param name='embed_code_version' value='3' /> <param name='path' value='shared/3JY66NKHM' /> <param name='toolbar' value='yes' /><param name='static_image' value='https://public.tableau.com/static/images/3J/3JY66NKHM/1.png' /> <param name='animate_transition' value='yes' /><param name='display_static_image' value='yes' /><param name='display_spinner' value='yes' /><param name='display_overlay' value='yes' /><param name='display_count' value='yes' /></object></div> <script type='text/javascript'> var divElement = document.getElementById('viz1553318506098'); var vizElement = divElement.getElementsByTagName('object')[0]; vizElement.style.width='1000px';vizElement.style.height='827px'; var scriptElement = document.createElement('script'); scriptElement.src = 'https://public.tableau.com/javascripts/api/viz_v1.js'; vizElement.parentNode.insertBefore(scriptElement, vizElement); </script>

Relationship between transit connectivity, street connectivity and bicycle friendliness
%%HTML
<div class='tableauPlaceholder' id='viz1553336447169' style='position: relative'><noscript><a href='#'><img alt=' ' src='https://public.tableau.com/static/images/PF/PFB9QW2HM/1_rss.png' style='border: none' /></a></noscript><object class='tableauViz' style='display:none;'><param name='host_url' value='https%3A%2F%2Fpublic.tableau.com%2F' /> <param name='embed_code_version' value='3' /> <param name='path' value='shared/PFB9QW2HM' /> <param name='toolbar' value='yes' /><param name='static_image' value='https://public.tableau.com/static/images/PF/PFB9QW2HM/1.png' /> <param name='animate_transition' value='yes' /><param name='display_static_image' value='yes' /><param name='display_spinner' value='yes' /><param name='display_overlay' value='yes' /><param name='display_count' value='yes' /><param name='filter' value='publish=yes' /></object></div> <script type='text/javascript'> var divElement = document.getElementById('viz1553336447169'); var vizElement = divElement.getElementsByTagName('object')[0]; if ( divElement.offsetWidth > 800 ) { vizElement.style.width='100%';vizElement.style.height=(divElement.offsetWidth*0.75)+'px';} else if ( divElement.offsetWidth > 500 ) { vizElement.style.width='100%';vizElement.style.height=(divElement.offsetWidth*0.75)+'px';} else { vizElement.style.width='100%';vizElement.style.height='1077px';} var scriptElement = document.createElement('script'); scriptElement.src = 'https://public.tableau.com/javascripts/api/viz_v1.js'; vizElement.parentNode.insertBefore(scriptElement, vizElement); </script>

Create a Model to predict the values for year 2019
features = ['Age_of_Death_2010','Age_of_Death_2012','Age_of_Death_2014']
X = health[features]
y = health['Age_of_Death_2016']
from sklearn.model_selection import train_test_split
X_train, X_test, y_train, y_test = train_test_split(X,y,test_size=0.3,random_state=42)
from sklearn.linear_model import LinearRegression
model = LinearRegression()
model.fit(X_train,y_train)
y_pred = model.predict(X_test)
from sklearn.metrics import mean_squared_error
print('RMSE : ',mean_squared_error(y_test,y_pred)**0.5)
Predict for the year 2019
features = ['Age_of_Death_2012','Age_of_Death_2014','Age_of_Death_2016']
X = health[features]
y_pred = model.predict(X)
health['Age_of_Death_2018'] = y_pred
health['Age_of_Death_2018'] = health['Age_of_Death_2018'].round()
health1 = health.nsmallest(5,'Age_of_Death_2018')
plt.style.use('ggplot')
y = [health1['Age_of_Death_2010'].mean(),health1['Age_of_Death_2012'].mean(),health1['Age_of_Death_2014'].mean(),health1['Age_of_Death_2016'].mean(),health1['Age_of_Death_2018'].mean()]
x = [2010,2012,2014,2016,2018]
plt.plot(x,y,marker='.')
plt.xlabel('year')
plt.ylabel('Mean Age of death')

features = ['Age_of_Death_2014','Age_of_Death_2016','Age_of_Death_2018']
X = health[features]
y_pred = model.predict(X)
health['Age_of_Death_2019'] = y_pred
health['Age_of_Death_2019'] = health['Age_of_Death_2019'].round()
health1 = health.nsmallest(5,'Age_of_Death_2019')
health['avg_age'] = (health['Age_of_Death_2010'] + health['Age_of_Death_2012'] + health['Age_of_Death_2014'] +health['Age_of_Death_2016'] + health['Age_of_Death_2018']+health['Age_of_Death_2019'] ) / 6
health_u = health.nsmallest(1,'avg_age')
plt.style.use('ggplot')
y = [health1['Age_of_Death_2010'].mean(),health1['Age_of_Death_2012'].mean(),health1['Age_of_Death_2014'].mean(),health1['Age_of_Death_2016'].mean(),health_u['Age_of_Death_2018'].mean(),health1['Age_of_Death_2019'].mean()]
x = [2010,2012,2014,2016,2018,2019]
plt.plot(x,y,marker='.')
plt.xlabel('year')
plt.ylabel('Mean Age of death')

counties = health.nsmallest(10,'Age_of_Death_2019')
NPA = counties.NPA.values
npa_val = pd.read_csv('NPA-NSA comparisson table.csv')
Following are the NPAs that need attention.
for i in NPA:
       print(npa_val[npa_val['NPA #']==i].values)
Health Insurance count (avg) among the top 10 NPAs that need attention
Since there are less count of personal insurance among the residents, there is a high reason to support the claims that the age of death will decline
%%HTML
<div class='tableauPlaceholder' id='viz1553332250202' style='position: relative'><noscript><a href='#'><img alt=' ' src='https://public.tableau.com/static/images/R8/R82BJZC6M/1_rss.png' style='border: none' /></a></noscript><object class='tableauViz' style='display:none;'><param name='host_url' value='https%3A%2F%2Fpublic.tableau.com%2F' /> <param name='embed_code_version' value='3' /> <param name='path' value='shared/R82BJZC6M' /> <param name='toolbar' value='yes' /><param name='static_image' value='https://public.tableau.com/static/images/R8/R82BJZC6M/1.png' /> <param name='animate_transition' value='yes' /><param name='display_static_image' value='yes' /><param name='display_spinner' value='yes' /><param name='display_overlay' value='yes' /><param name='display_count' value='yes' /><param name='filter' value='publish=yes' /></object></div> <script type='text/javascript'> var divElement = document.getElementById('viz1553332250202'); var vizElement = divElement.getElementsByTagName('object')[0]; vizElement.style.width='1000px';vizElement.style.height='827px'; var scriptElement = document.createElement('script'); scriptElement.src = 'https://public.tableau.com/javascripts/api/viz_v1.js'; vizElement.parentNode.insertBefore(scriptElement, vizElement); </script>

%%HTML
<div class='tableauPlaceholder' id='viz1553333484929' style='position: relative'><noscript><a href='#'><img alt=' ' src='https://public.tableau.com/static/images/Ph/Pharmacyunits/Dashboard3/1_rss.png' style='border: none' /></a></noscript><object class='tableauViz' style='display:none;'><param name='host_url' value='https%3A%2F%2Fpublic.tableau.com%2F' /> <param name='embed_code_version' value='3' /> <param name='site_root' value='' /><param name='name' value='Pharmacyunits/Dashboard3' /><param name='tabs' value='no' /><param name='toolbar' value='yes' /><param name='static_image' value='https://public.tableau.com/static/images/Ph/Pharmacyunits/Dashboard3/1.png' /> <param name='animate_transition' value='yes' /><param name='display_static_image' value='yes' /><param name='display_spinner' value='yes' /><param name='display_overlay' value='yes' /><param name='display_count' value='yes' /><param name='filter' value='publish=yes' /></object></div> <script type='text/javascript'> var divElement = document.getElementById('viz1553333484929'); var vizElement = divElement.getElementsByTagName('object')[0]; vizElement.style.width='1000px';vizElement.style.height='827px'; var scriptElement = document.createElement('script'); scriptElement.src = 'https://public.tableau.com/javascripts/api/viz_v1.js'; vizElement.parentNode.insertBefore(scriptElement, vizElement); </script>
Predictions for the NPAs
This part involves a tentative prediction of the values just to support the claims. The model involves linear regression and elastic net regression. There was no need of hyperparameter tuning, as the RMSE values were intact.
Predicitons involve
- Data Cleaning
- Model Instantiation
- Model prediction for already available column (to obtain the accuracy)
- Model Prediction for the year 2019
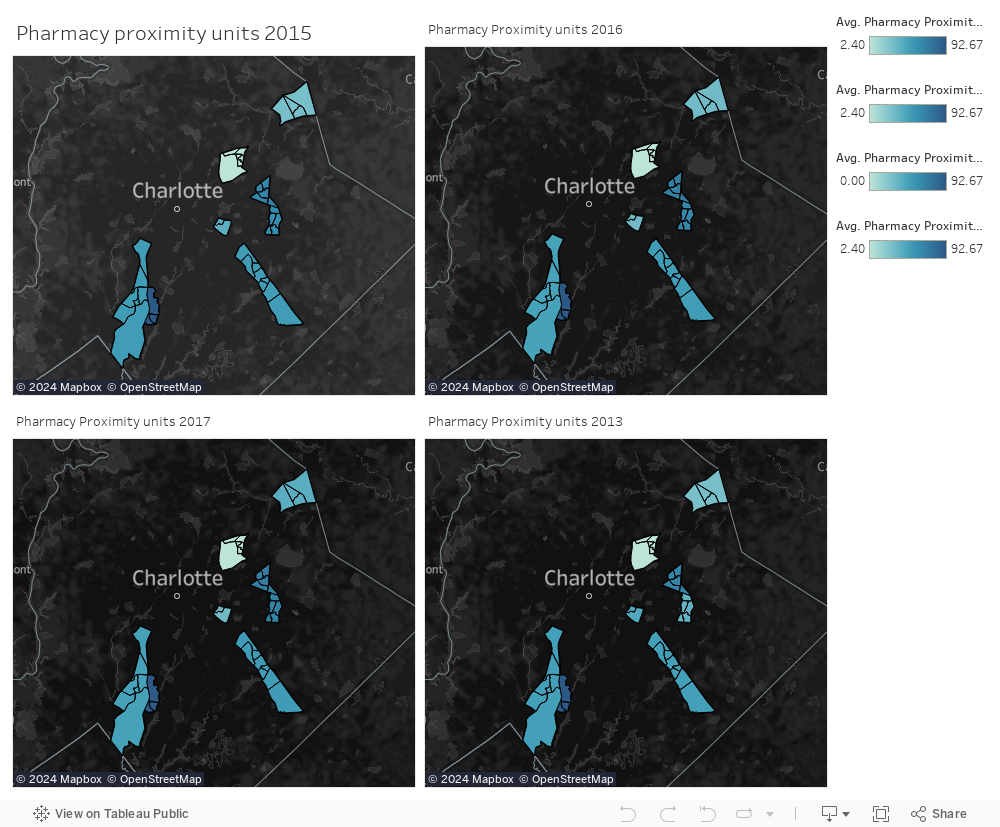
Pharmacy units prediction. Data visualization and predicting the no.of units for the year 2019
features = ['Pharmacy_Proximate_Units_2011','Pharmacy_Proximate_Units_2013','Pharmacy_Proximate_Units_2015','Pharmacy_Proximate_Units_2016','Pharmacy_Proximate_Units_2017']
for i in features:
    print('Null values in', i, 'are' ,health[i].isnull().sum())
for i in features:
    val = health[i].mean()
    health[i].fillna(val,inplace=True)
for i in features:
    print('Null values in', i, 'are' ,health[i].isnull().sum())
We try to get the average of 10 NPAs for each year
year_2011 = []
health_pharm = health[['NPA','Pharmacy_Proximate_Units_2011']]
for i in NPA:
    year_2011.append(health_pharm['Pharmacy_Proximate_Units_2011'][health_pharm['NPA']==i].values)
year_2011 = np.sum(year_2011)/len(year_2011)
year_2013 = []
health_pharm = health[['NPA','Pharmacy_Proximate_Units_2013']]
for i in NPA:
    year_2013.append(health_pharm['Pharmacy_Proximate_Units_2013'][health_pharm['NPA']==i].values)
year_2013 = np.sum(year_2013)/len(year_2013)
year_2015 = []
health_pharm = health[['NPA','Pharmacy_Proximate_Units_2015']]
for i in NPA:
    year_2015.append(health_pharm['Pharmacy_Proximate_Units_2015'][health_pharm['NPA']==i].values)
year_2015 = np.sum(year_2015)/len(year_2015)
year_2017 = []
health_pharm = health[['NPA','Pharmacy_Proximate_Units_2017']]
for i in NPA:
    year_2017.append(health_pharm['Pharmacy_Proximate_Units_2017'][health_pharm['NPA']==i].values)
year_2017 = np.sum(year_2017)/len(year_2017)
print(year_2011,year_2013,year_2015,year_2017)
year_2016 = []
health_pharm = health[['NPA','Pharmacy_Proximate_Units_2016']]
for i in NPA:
    year_2016.append(health_pharm['Pharmacy_Proximate_Units_2016'][health_pharm['NPA']==i].values)
Looks like there is a brightness in the future of the Pharmacetical units in the 10 NPAs
plt.style.use('ggplot')
y = [year_2011,year_2013,year_2015,year_2017]
x = [2011,2013,2015,2017]
plt.plot(x,y,marker='.')
plt.xlabel('year')
plt.ylabel('Mean Age of death')

features = ['Pharmacy_Proximate_Units_2011','Pharmacy_Proximate_Units_2013','Pharmacy_Proximate_Units_2015','Pharmacy_Proximate_Units_2016']
X = health[features]
y = health['Pharmacy_Proximate_Units_2017']
X_train, X_test, y_train, y_test = train_test_split(X,y,test_size=0.2,random_state=42)
model.fit(X_train,y_train)
y_pred = model.predict(X_test)
from sklearn.metrics import mean_squared_error
print('RMSE : ',mean_squared_error(y_test,y_pred)**0.5)
Predict for year 2019
features = ['Pharmacy_Proximate_Units_2013','Pharmacy_Proximate_Units_2015','Pharmacy_Proximate_Units_2016','Pharmacy_Proximate_Units_2017']
X = health[features]
y_pred = model.predict(X)
health['Pharmacy_Proximate_Units_2019'] = y_pred
health['Pharmacy_Proximate_Units_2019'] = health['Pharmacy_Proximate_Units_2019'].round()
y = [health['Pharmacy_Proximate_Units_2011'].mean(),health['Pharmacy_Proximate_Units_2013'].mean(),health['Pharmacy_Proximate_Units_2015'].mean(),health['Pharmacy_Proximate_Units_2016'].mean(),health['Pharmacy_Proximate_Units_2017'].mean(),health['Pharmacy_Proximate_Units_2019'].mean()]
x = [2011,2013,2015,2016,2017,2019]
plt.plot(x,y,marker='.')
plt.xlabel('year')
plt.ylabel('Mean No. of Units')

Public health Insurance Prediction for year 2019
features = ['Public_Health_Insurance _2014','Public_Health_Insurance _2015','Public_Health_Insurance _2017']
for i in features:
    print('Null values in', i, 'are' ,health[i].isnull().sum())
for i in features:
    val = health[i].mean()
    health[i].fillna(val,inplace=True)
for i in features:
    print('Null values in', i, 'are' ,health[i].isnull().sum())
features = ['Public_Health_Insurance _2014','Public_Health_Insurance _2015']
X = health[features]
y = health['Public_Health_Insurance _2017']
from sklearn.linear_model import ElasticNet
elastic = ElasticNet(alpha=0.1)
X_train, X_test, y_train, y_test = train_test_split(X,y,test_size=0.2,random_state=42)
elastic.fit(X_train,y_train)
y_pred = elastic.predict(X_test)
from sklearn.metrics import mean_squared_error
print('RMSE : ',mean_squared_error(y_test,y_pred)**0.5)
features = ['Public_Health_Insurance _2015','Public_Health_Insurance _2017']
X = health[features]
y_pred = elastic.predict(X)
health['Public_Health_Insurance _2019'] = y_pred
health['Public_Health_Insurance _2019'] = health['Public_Health_Insurance _2019'].round()
y = [health['Public_Health_Insurance _2014'].mean(),health['Public_Health_Insurance _2015'].mean(),health['Public_Health_Insurance _2017'].mean(),health['Public_Health_Insurance _2019'].mean()]
x = [2014,2015,2017,2019]
plt.plot(x,y,marker='.')
plt.xlabel('year')
plt.ylabel('Mean')

Low Cost Healthcare Proximity units prediction for 2019
features = ['Low_Cost_Healthcare_Proximate_Units_2016','Low_Cost_Healthcare_Proximate_Units_2017']
for i in features:
    print('Null values in', i, 'are' ,health[i].isnull().sum())
for i in features:
    val = health[i].mean()
    health[i].fillna(val,inplace=True)
for i in features:
    print('Null values in', i, 'are' ,health[i].isnull().sum())
X = health[features]
y_pred = elastic.predict(X)
health['Low_Cost_Healthcare_Proximate_Units_2019'] = y_pred
health['Low_Cost_Healthcare_Proximate_Units_2019'] = health['Low_Cost_Healthcare_Proximate_Units_2019'].round()
y = [health['Low_Cost_Healthcare_Proximate_Units_2016'].mean(),health['Low_Cost_Healthcare_Proximate_Units_2017'].mean(),health['Low_Cost_Healthcare_Proximate_Units_2019'].mean()]
x = [2016,2017,2019]
plt.plot(x,y,marker='.')
plt.xlabel('year')
plt.ylabel('Mean No. of Units')

Conclusion and Criticism
Thus, we could focus more on the NPAs that need special care to improve the quality of life in charlotte. However, the model accuracy is fairly accurate and the 2019 predictions might be changing as there were severe oscillations in certain values of the dataset