 Optical Colonoscopy Video Tracking
 - Related Publications:
- Jianfei Liu, Kalpathi Subramanian, Terry Yoo, Robert Van Uitert,
``A Stable Optic-Flow Based Method for Tracking Colonoscopy Images",
Proceedings of Mathematical Methods in Biomedical Image Analysis
(MMBIA) 2008, June 27-28, 2008, Anchorage, Alaska.
[Full Paper(PDF)]
- Jianfei Liu, Kalpathi Subramanian, Terry Yoo, Robert Van Uitert,
``A Stable Optic-Flow Based Method for Tracking Colonoscopy Images",
Proceedings of Mathematical Methods in Biomedical Image Analysis
(MMBIA) 2008, June 27-28, 2008, Anchorage, Alaska.
-
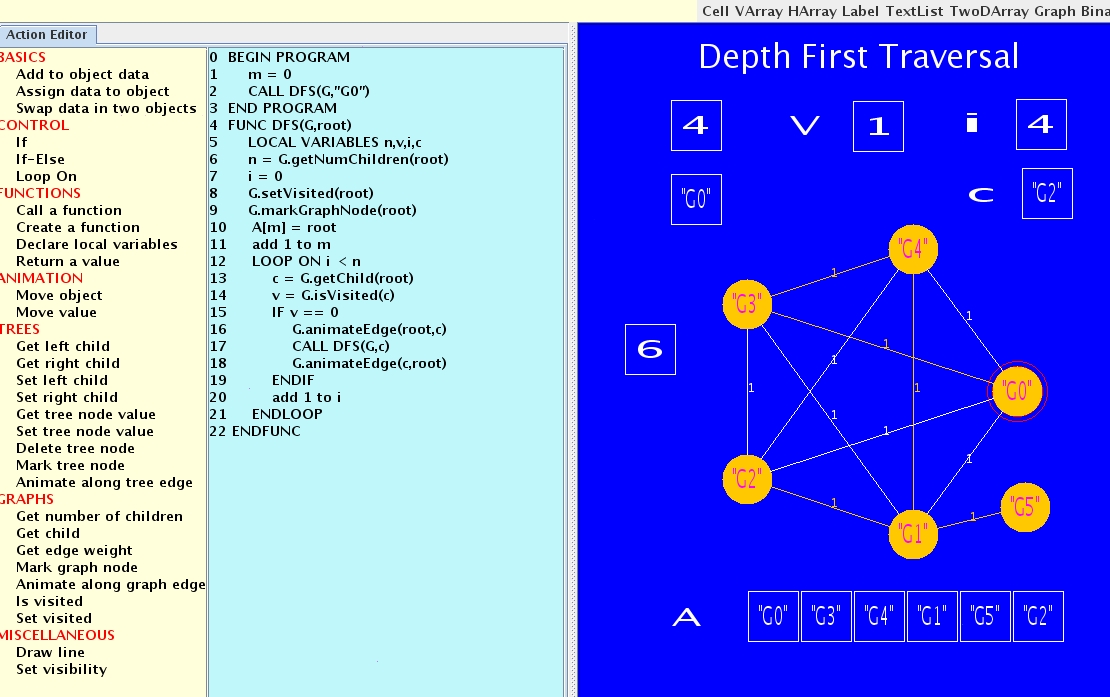
Visual Learning Engine
- Related Publications:
- Kalpathi Subramanian, Tom Cassen, ``A Cross-Domain Visual Learning
Engine for Interactive Generation of Instructional Materials",
Proceedings of ACM Special Interest Group on Computer Science
Education 2008(SIGCSE 2008), March 12-15, 2008, Portland,
Oregon, USA.
[Full Paper(PDF)]
- Kalpathi Subramanian, Tom Cassen, ``A Cross-Domain Visual Learning
Engine for Interactive Generation of Instructional Materials",
Proceedings of ACM Special Interest Group on Computer Science
Education 2008(SIGCSE 2008), March 12-15, 2008, Portland,
Oregon, USA.
-
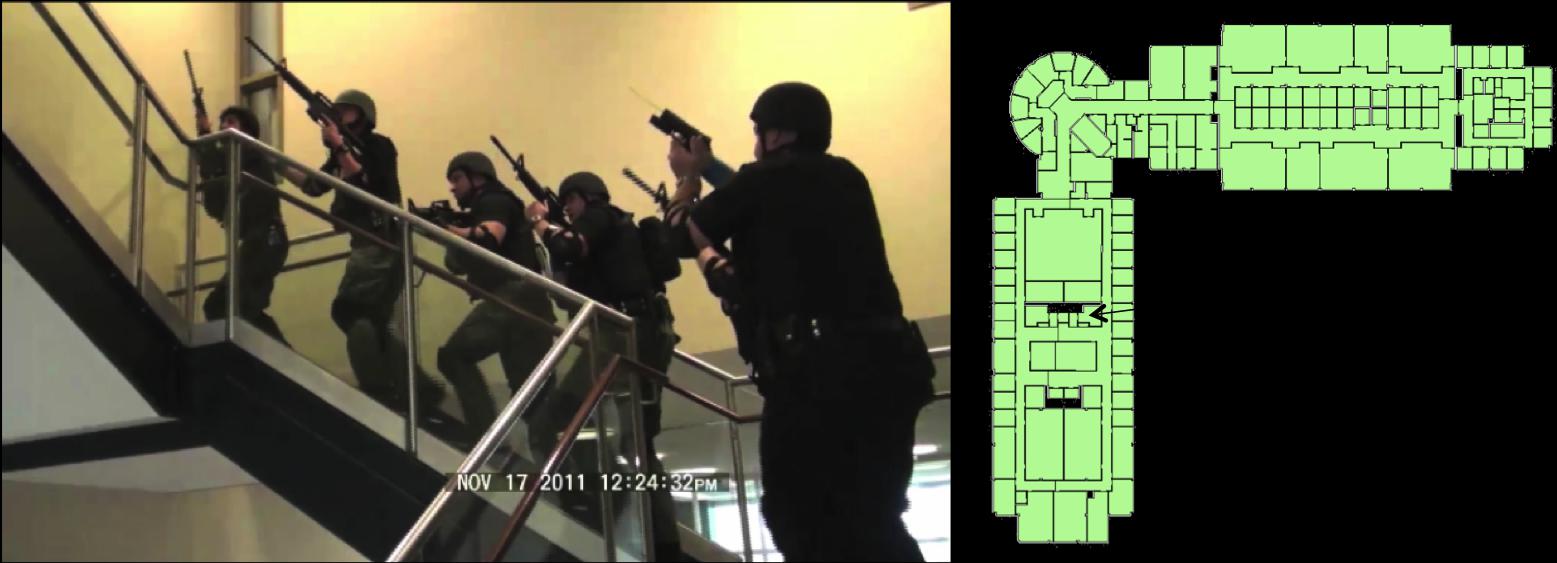
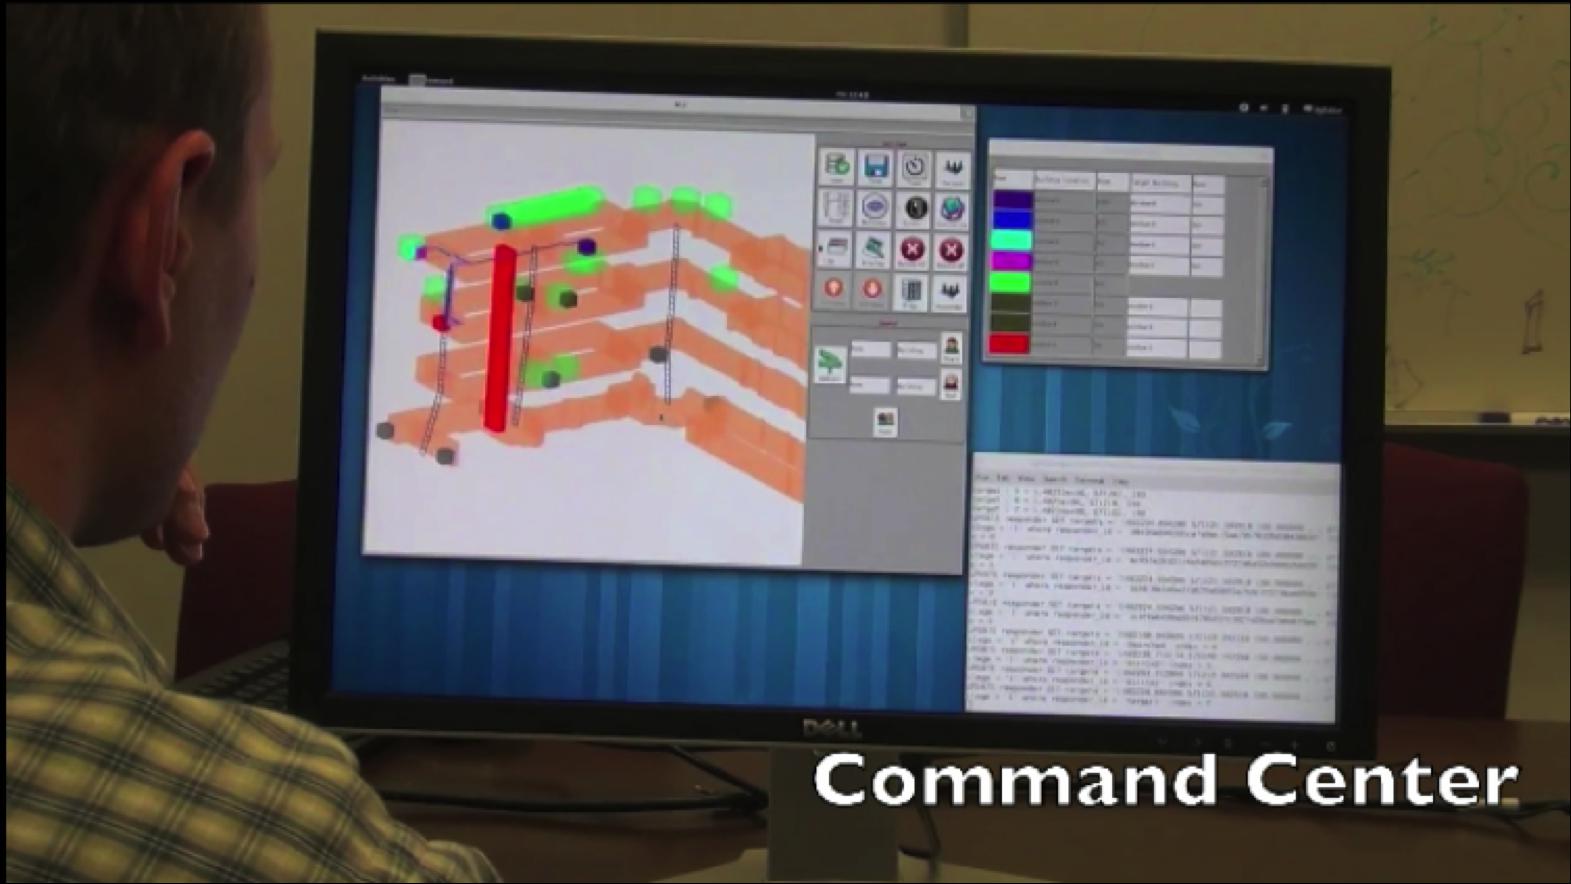
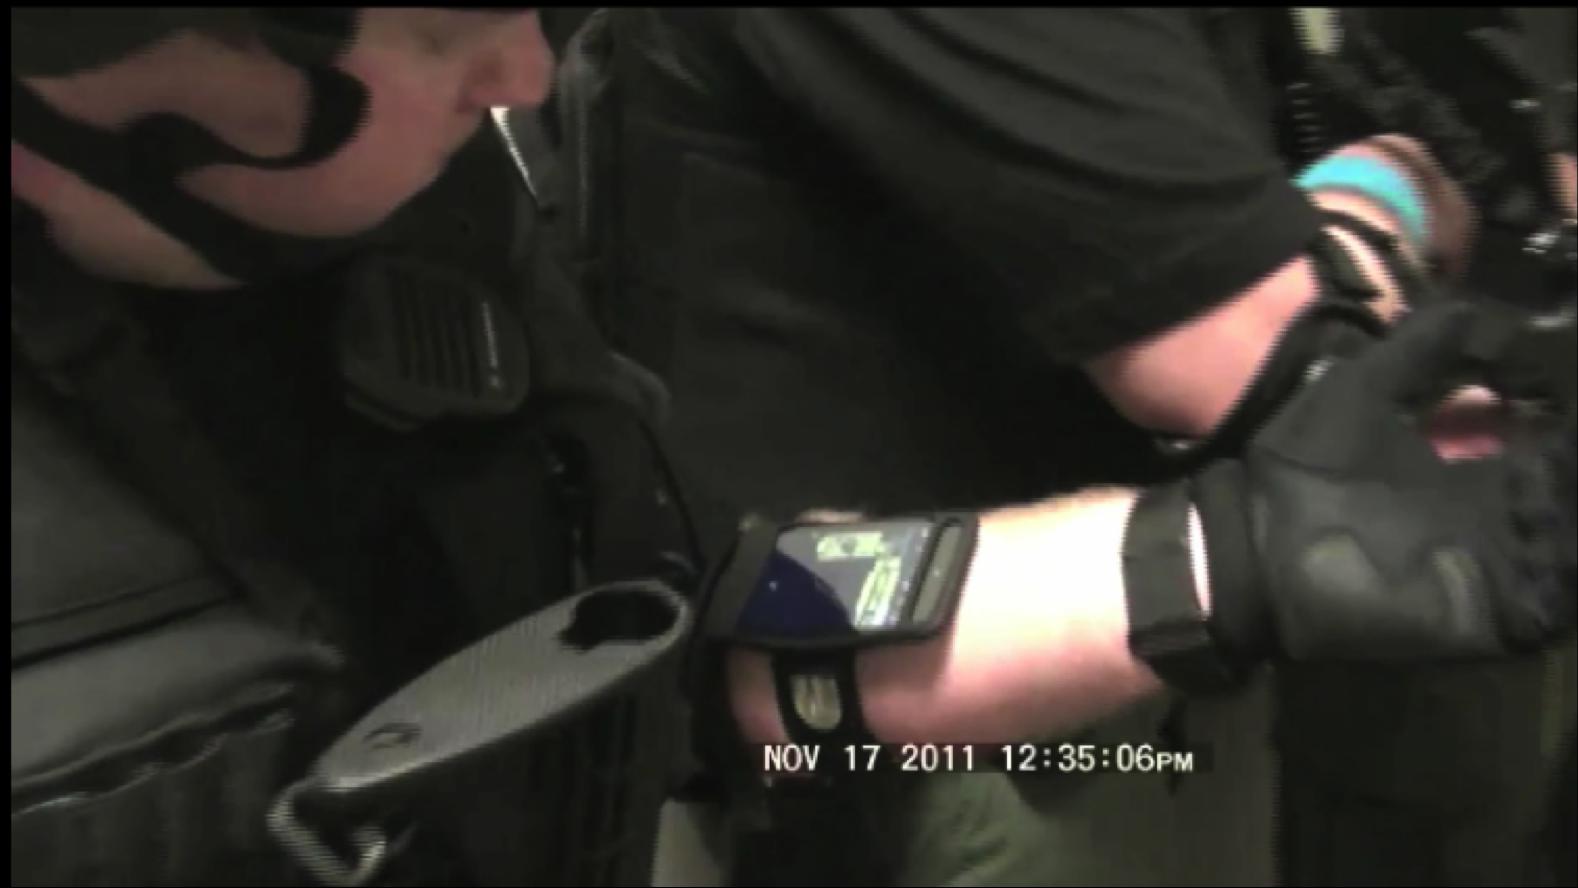
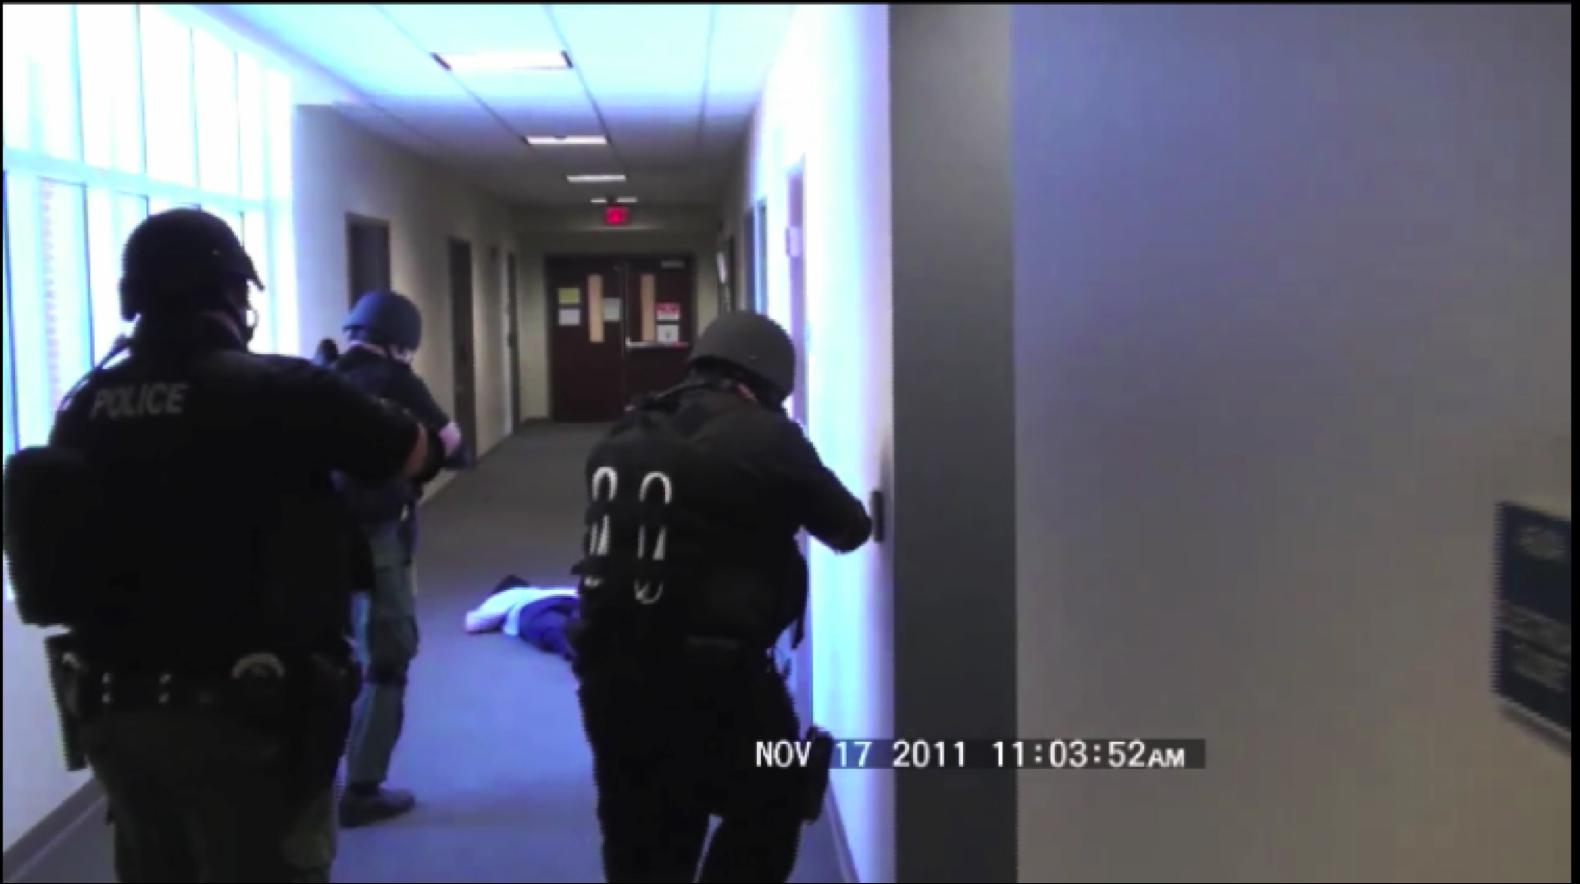
Situationally Aware Effective Emergency Response Within Large Urban Structures
- Related Publications:
- Jianfei Liu, Kyle Lyons, Kalpathi Subramanian, William Ribarsky,
``Semi-Automated Processing and Routing Within Indoor Structures
For Emergency Response Applications",
Proceedings of SPIE Defense, Security+Sensing, 2010, Orlando,
FL (To appear)
[Full Paper(PDF)]
[MOVIE-EERC System(Quicktime)][MOVIE-Training Exercise(MPEG)]
[MediaReport(WSOC TV)-TrainingExercise(Quicktime)(72 MBytes)]
[MediaReport(WSOC TV)-TrainingExercise(Quicktime)(162 MBytes)]
-
[Best Student Paper]
Jack Guest, Todd Eaglin, Kalpathi Subramanian, William Ribarsky, ``Visual
Analysis of Situationally Aware Building Evacuations",
SPIE Conference on Visualization and Data
Analysis 2013(VDA 2013), IS&T/SPIE Electronic Imaging,
Feb. 4-6, 2013, San Francisco, CA.
[Full Paper(PDF)][MOVIE-Evac Table Top Exercise(Quicktime)]
- Jianfei Liu, Kyle Lyons, Kalpathi Subramanian, William Ribarsky,
``Semi-Automated Processing and Routing Within Indoor Structures
For Emergency Response Applications",
Proceedings of SPIE Defense, Security+Sensing, 2010, Orlando,
FL (To appear)
[Full Paper(PDF)]
Current Research Projects
The project focuses on the problem of plotting the position of an
endoscopic camera (during a colonoscopy procedure) on the correspond-
ing pre-operative CT scan of the patient. Given that virtual colonoscopy
is emerging as an alternate screening tool, automatic tracking
techniques can benefit colonoscopy procedures by presenting both
modalities simultaneously and possibly reduce errors.
This project involves the construction of an infrastructure for visual
learning system. The system provides an interactive interface for
building teaching modules, thus enabling instructors across disciplines
easy access and use of the system for building visually rich
content. The initial version of the system has been developed to
handle basic concepts in computer science, specifically algorithms
and data structures.
Past Research Projects
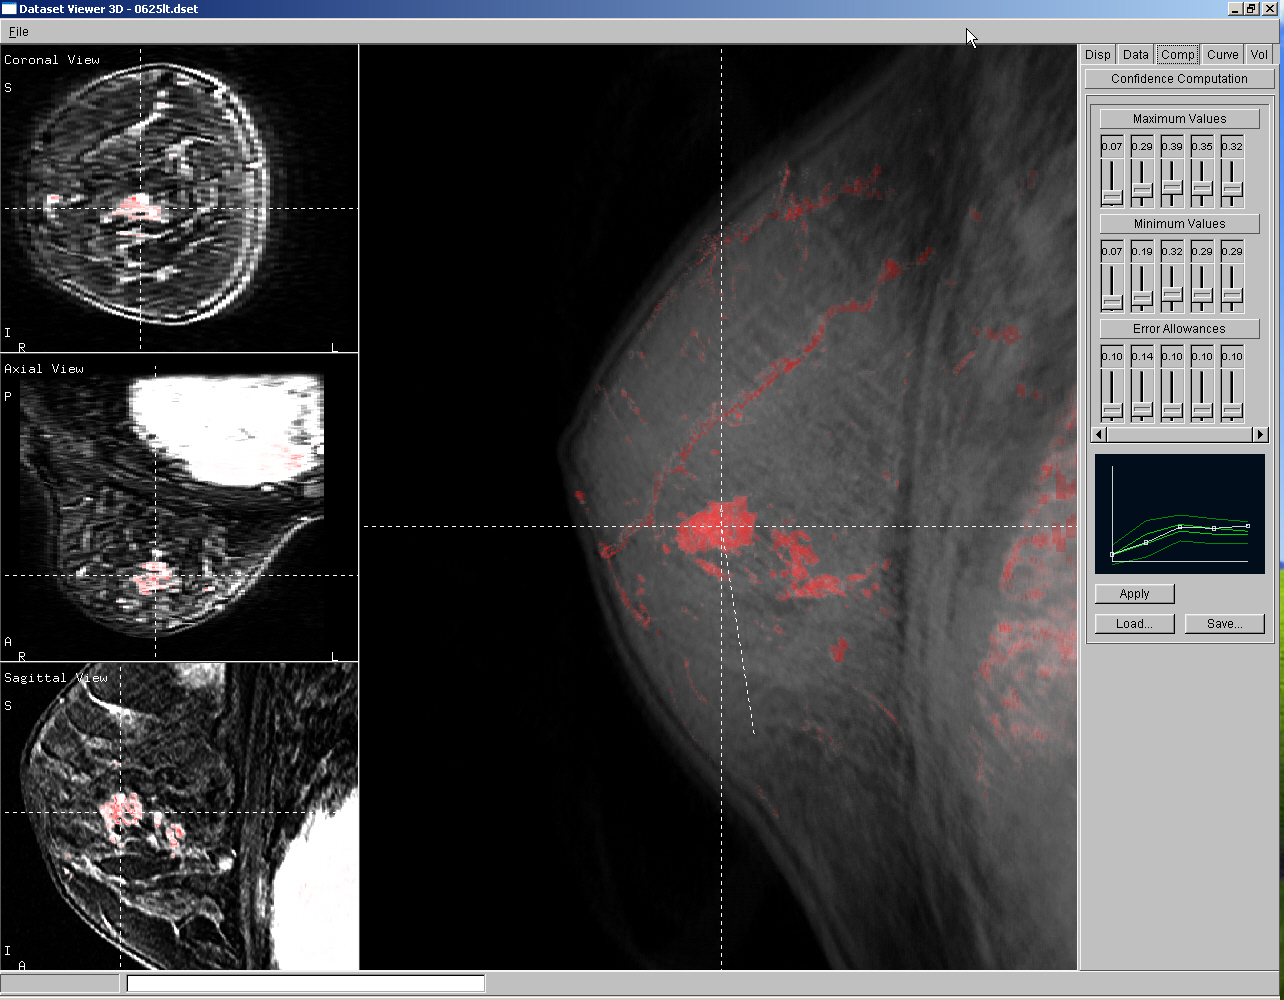
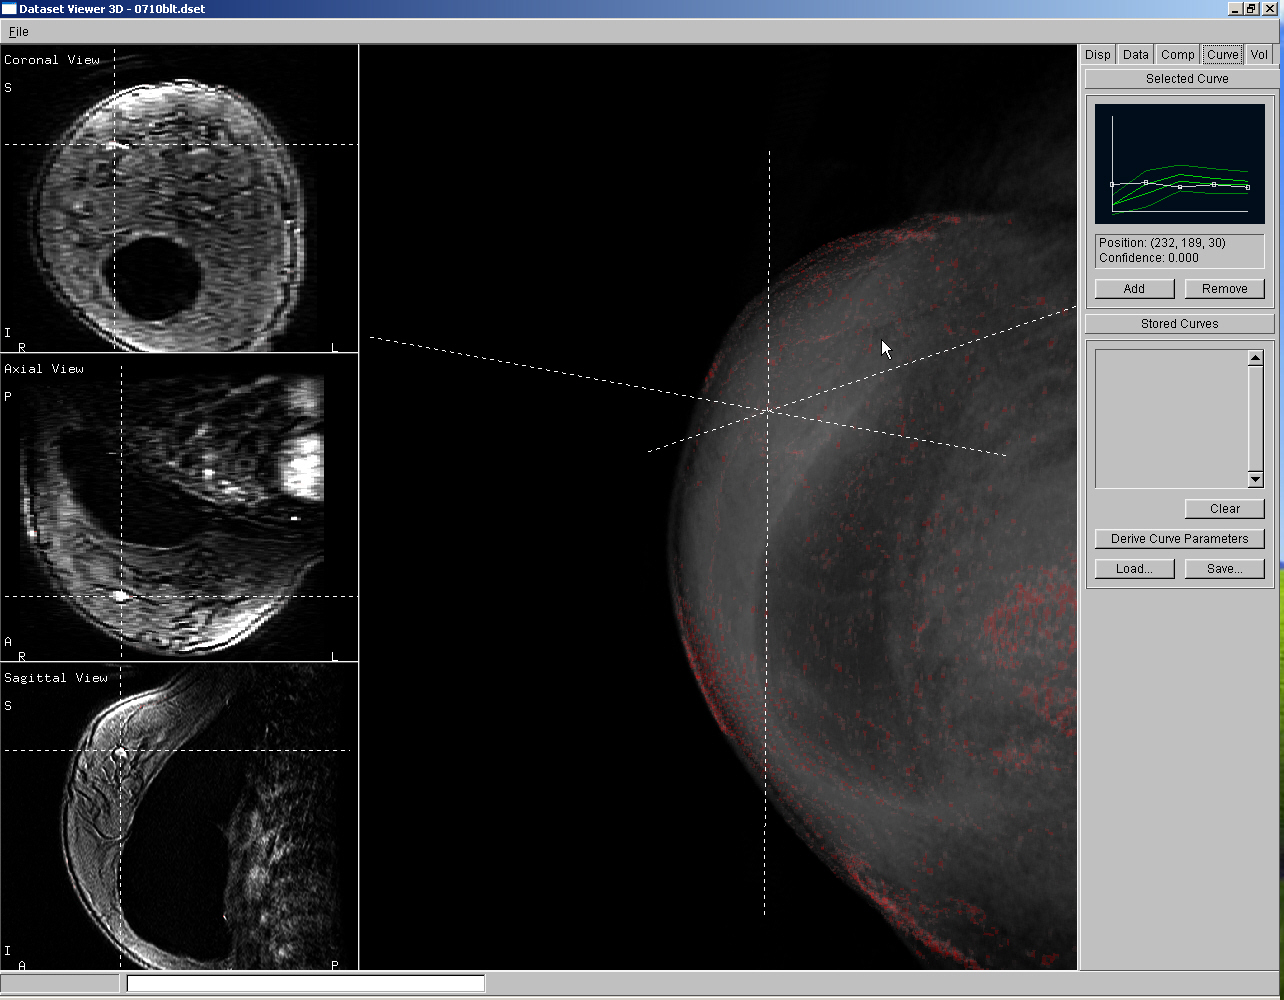
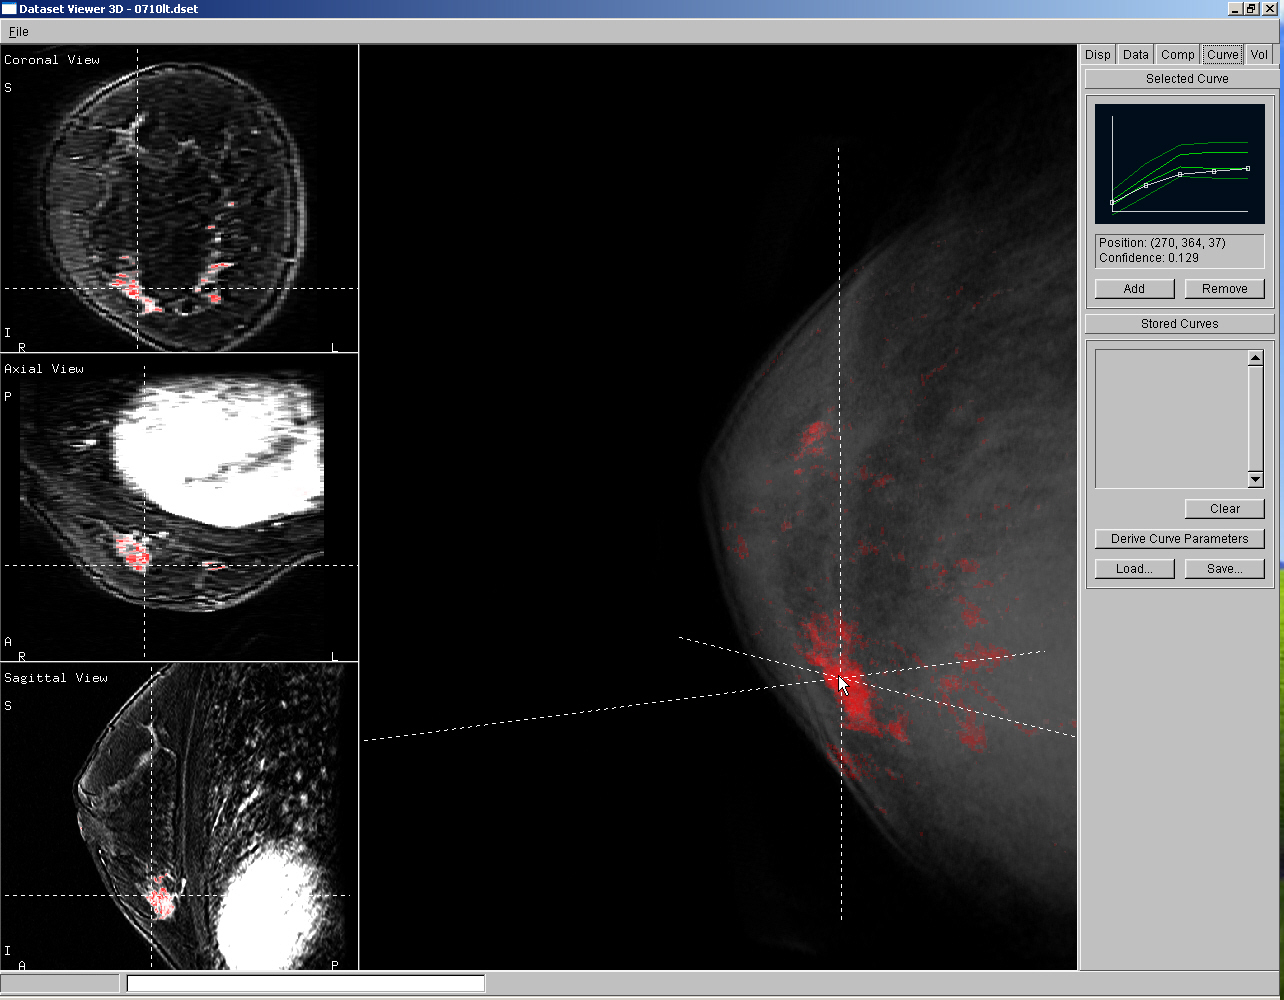
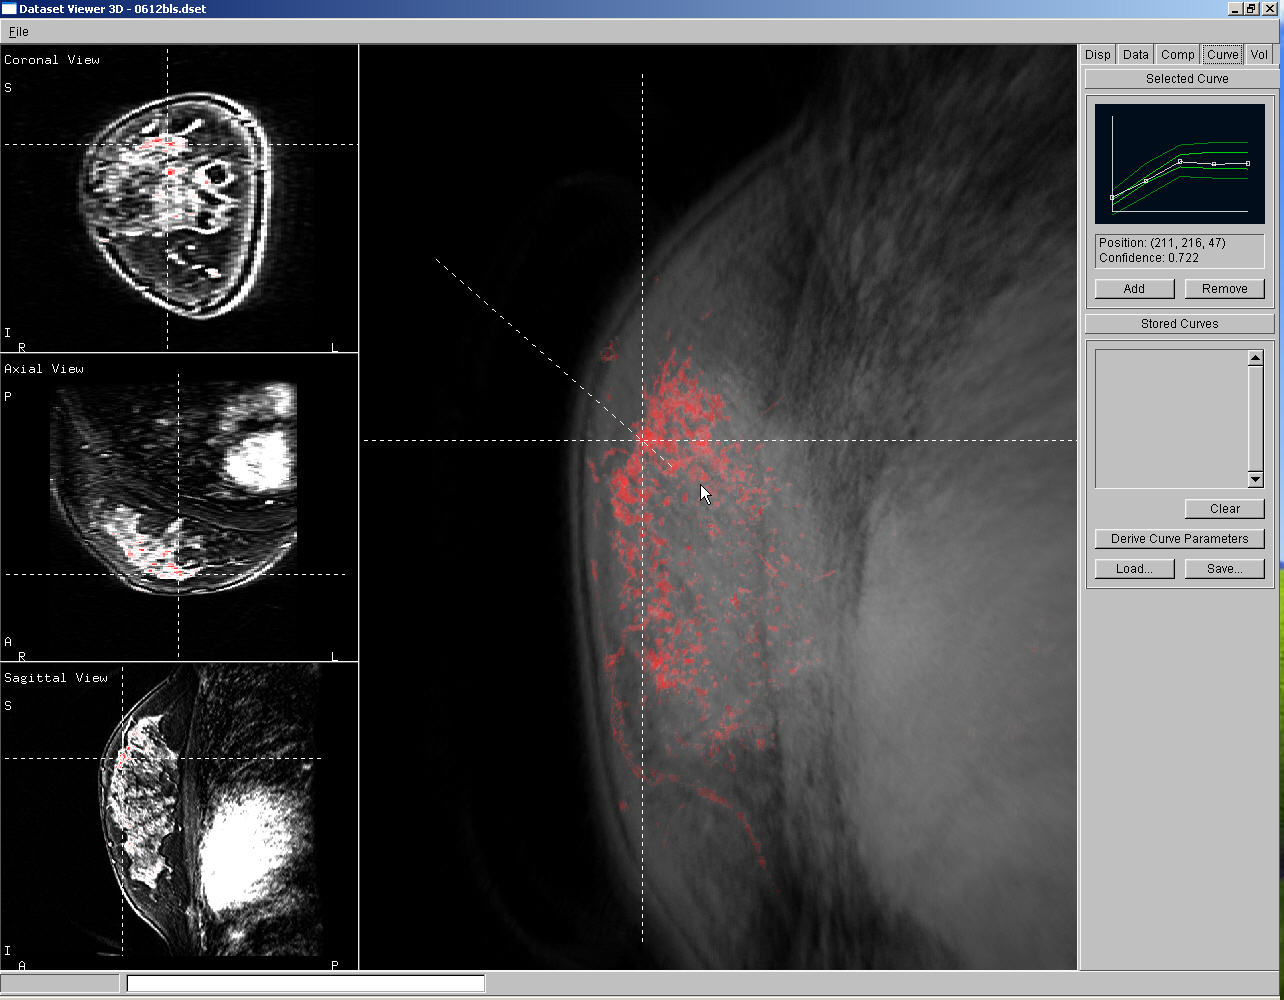
 Interactive Detection, Visualization and Quantification
of Breast Lesions from DCE-MRI Volumes
Interactive Detection, Visualization and Quantification
of Breast Lesions from DCE-MRI Volumes
Mammography is currently regarded as the most effective and widely used
method for early detection of breast cancer, but recently its
lower sensitivity in certain high risk cases has been less than desired.
The use of Dynamic Contrast Enhanced MRI (DCE-MRI) has gained
considerable attention in recent years, especially for high risk
cases, for smaller multi-focal lesions, or very sparsely distributed
lesions. This project is focused on constructing interactive visualization
tools to identify, process, visualize and quantify lesions from
DCE-MRI volumes. Our approach segments the time varying volume data
in near-real time and employs 3D texture mapped volume rendering in
a highly interactive environment.
(Joint Work with Dr. John Brockway, Novant HealthCare, Charlotte, NC).
Sample 3D Reconstructions:


